From the information in this page or on the Xplain Data homepage, you might have already found out that ObjectAnalytics is a powerful tool to store and search through data efficiently. Of course, knowing something practically is worth more than knowing it only theoretically. Hence, we decided to do a simulation study comparing various Causal Discovery Algorithms.
In this text, the general concepts of Causal Discovery and ObjectAnalytics are explained. It is aimed to show that Causal Discovery methods massively profit from an ObjectAnalytics approach.
To show this, a number of well-known Causal Discovery algorithms, such as
DAG with no Tears
Direct LinGam
FCI
GES
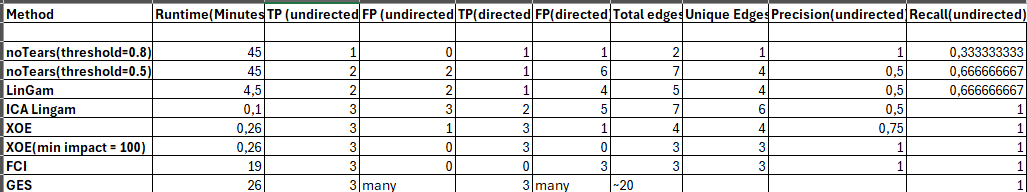
are tested on a simulated dataset with known DAG. These results are then compared to the XCD results and it turns out that the XCD is not only the most precise algorithm, it also reduces the runtime of the algorithm up to 100x!
If you are only interested in the simulation study results, here they are
Hi @ILecei - that really sounds interesting! I’m really curious how you have generated the synthetic data and how the ground truth looks like. I already discussed with @Michael.Haft that it may makes sense to specifically think about data models that fit the object analytics paradigm - if you are open for an exchange here, let me know!
One more thing: gadjid (paper here) may be a framework of interest tpo you: It holds lots of metrics relevant for causal discovery (like SHD, SID, and related) that measure in a more causal sense (than comparing edges) the distance of a learned DAG to the ground truth DAG. Moreover, in gcastle, lots of CD-algorithms are implemetned for easy use.
I am happy to see that you are interested in the simulation study!
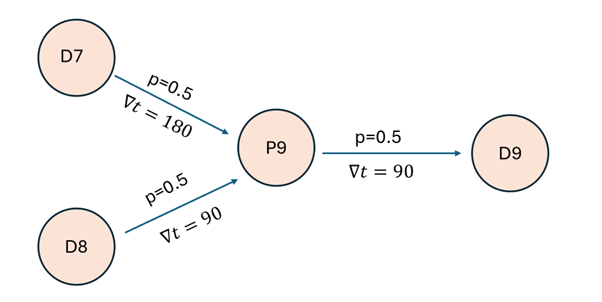
As a first shot, we started with a quite small DAG, where each causal relation happens only wih a pre-defined probability p and a timeshift t.
D7 for example stands for Diagnosis 7, P9 for Prescription 9 etc. These time-dependent relations is what most standard algorithms struggle with, as I have to build time dependent features myself first (discussed in the not yet published document mentioned further above).
As a short summary, for each patient the event times of the various diagnoses and prescriptions have been simulated with Poisson Point Process. Then the dependencies depicted in the DAG have been added manually.
Thanks a lot for the further reading recommendations, I’d be happy to discuss further steps and improvements!