Here you can find an example analysis on the open FDZ Data :
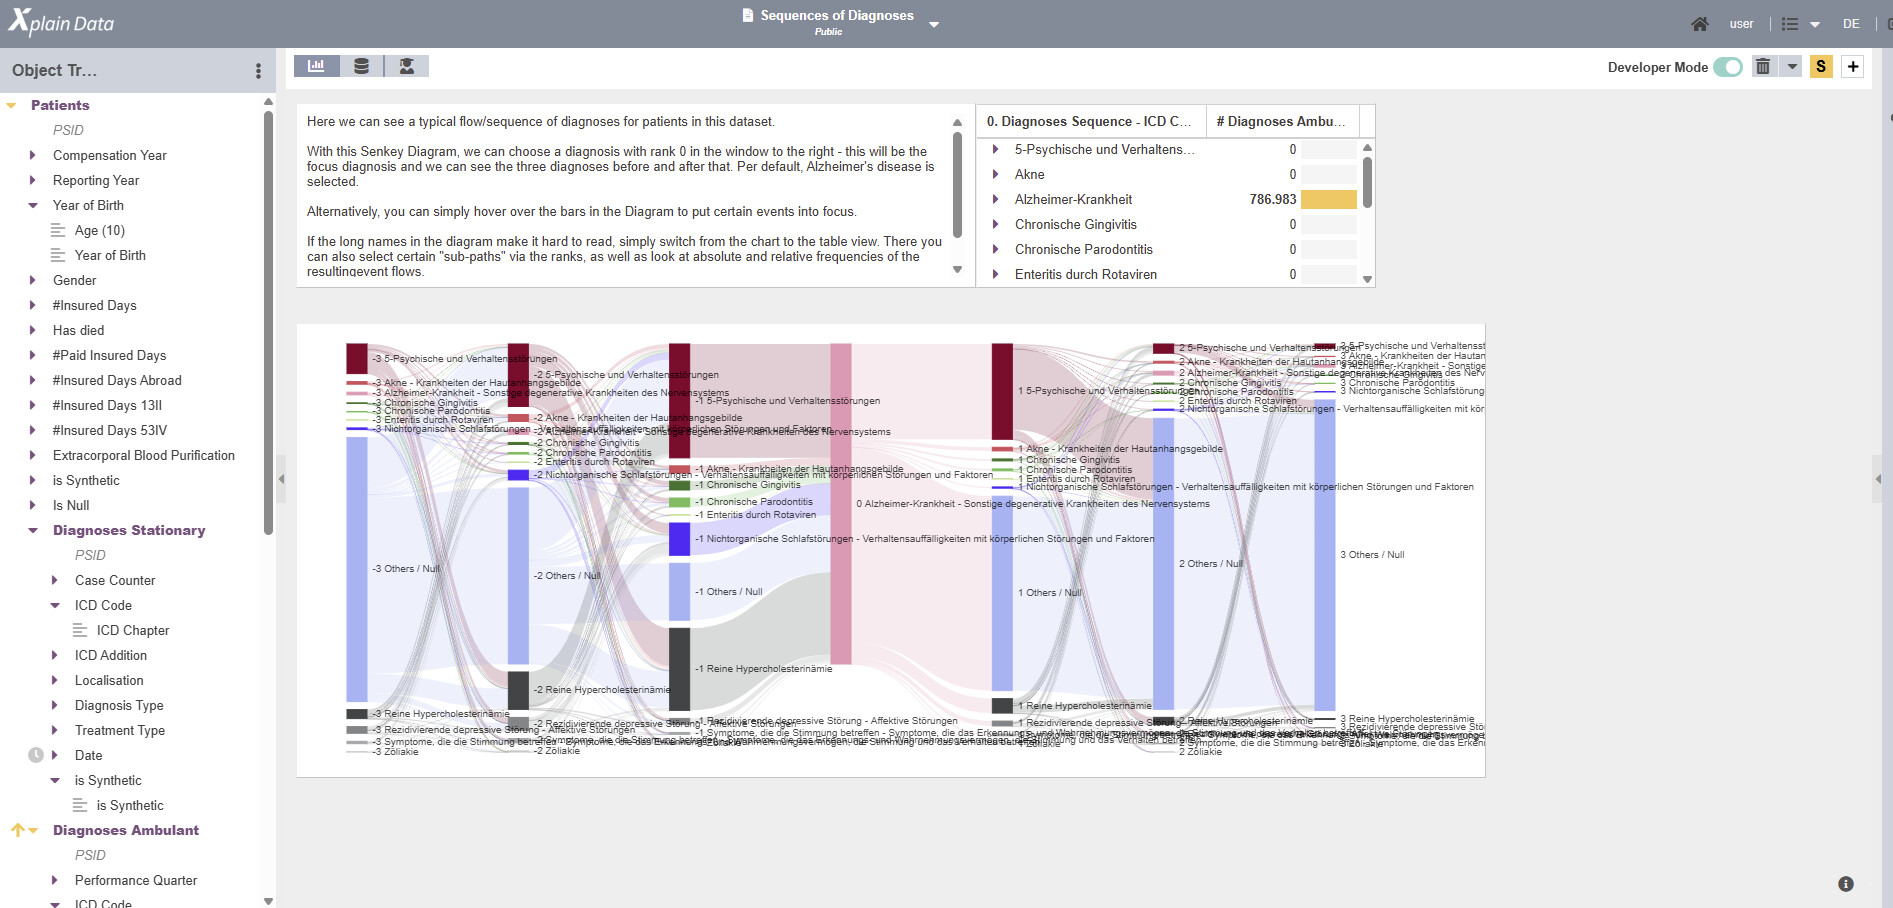
A very powerful tool of the XOE are so called Sankey Diagrams, with which it is very easy to compute and visualize event flows, say, the flow or the order of diagnoses for each patient.
One important thing to note that this kind of analysis is much more performant when data is stored as objects. Having to look for all the relevant information in a relational database is extremely tedious and inefficient!
They can be set up in multiple ways, for example, in this analysis we set it up such that a certain event of interest can be put in focus. Per default, “Alzheimer’s disease” is selected as a target, but you may change this specific selection. For the selected diagnosis, we can see the first three diagnoses before and after the target.
Why it is important - if I compare objects, which behave differently, for example patients with and without a certain disease, the flow or the order of events for these patients is probably different and might hint at causal factors for the target!
Simply load the analysis from the home dashboard, read the description texts and just make some selections to observe how the chart responds!
Click to launch the FDZ data model.
User : user
PWD : xplainData